
Checking in on Our Nominal World
Using the NGDP Gap to Assess Aggregate Demand Pressures and the Stance of Macroeconomic Policy

Scott Sumner once quipped that the real world is nominal. In the United States, that means our economic lives—payments, debt, and income—are conducted in dollar terms. We ultimately care about real economic activity, but we observe and operate in nominal values. As a result, if there are frictions in the nominal economy—such as sticky prices, sticky wages, sticky debt contracts, or sticky information—it becomes essential to keep total dollar activity stable. Otherwise, shocks to nominal spending will spill over into real economic outcomes. That is why it’s important to regularly check in on the state of the nominal economy.
Many observers might be tempted to look at inflation to assess the state of the nominal economy. Inflation, however, can be a misleading guide, since in the short run it may reflect both real (supply-side) and nominal (demand-side) shocks. For example, a surge in prices might stem from global supply chain disruptions rather than excess aggregate demand pressures—or vice versa. To get a clearer read on the nominal economy itself, a better approach is to directly examine total dollar spending relative to a benchmark or expected path for it.
Over at the Mercatus Center, we report just such measure: the NGDP Gap. This measure is the difference between the actual and an estimated benchmark path for NGDP. NGDP measures total dollar spending on all final goods and services sold in the United States and, therefore, is a measure of the overall nominal economy.
The benchmark path for NGDP, which can be viewed as its neutral level, is estimated by taking the average of past forecasts of NGDP for a given quarter. Specifically, it averages forecasts for a given quarter of NGDP from the past 20 quarters:
The benchmark measure is based on a simple idea: the neutral value for the current period’s nominal spending should be what was expected by the public as they were making their economic plans over the past 20 quarters. If total dollar spending is below the benchmark path, then macroeconomic policy is contractionary. If total dollar spending is above it, then macroeconomic policy is expansionary.
With the release of the 2025Q1 GDP data this week, we can now take a look at the latest NGDP Gap and, in so doing, provide an official check in on the state of the nominal economy.
The Nominal Economy Check In
Using forecast data from the Survey of Professional Forecasters, the figure below shows the benchmark path for the dollar size of the economy for both the 50th (median) and 10th-90th percentiles versus the actual dollar size.

The figure reveals that the dollar size of the economy has been persistently higher than expectations since 2021Q4, though the gap is shrinking. As of 2025Q1, the dollar size is $1.31 trillion larger than the median (50th percentile) expected path, but only $0.35 trillion larger the 90th percentile. The narrowing of the NGDP Gap can be seen in the chart below which shows the percent difference between the series:
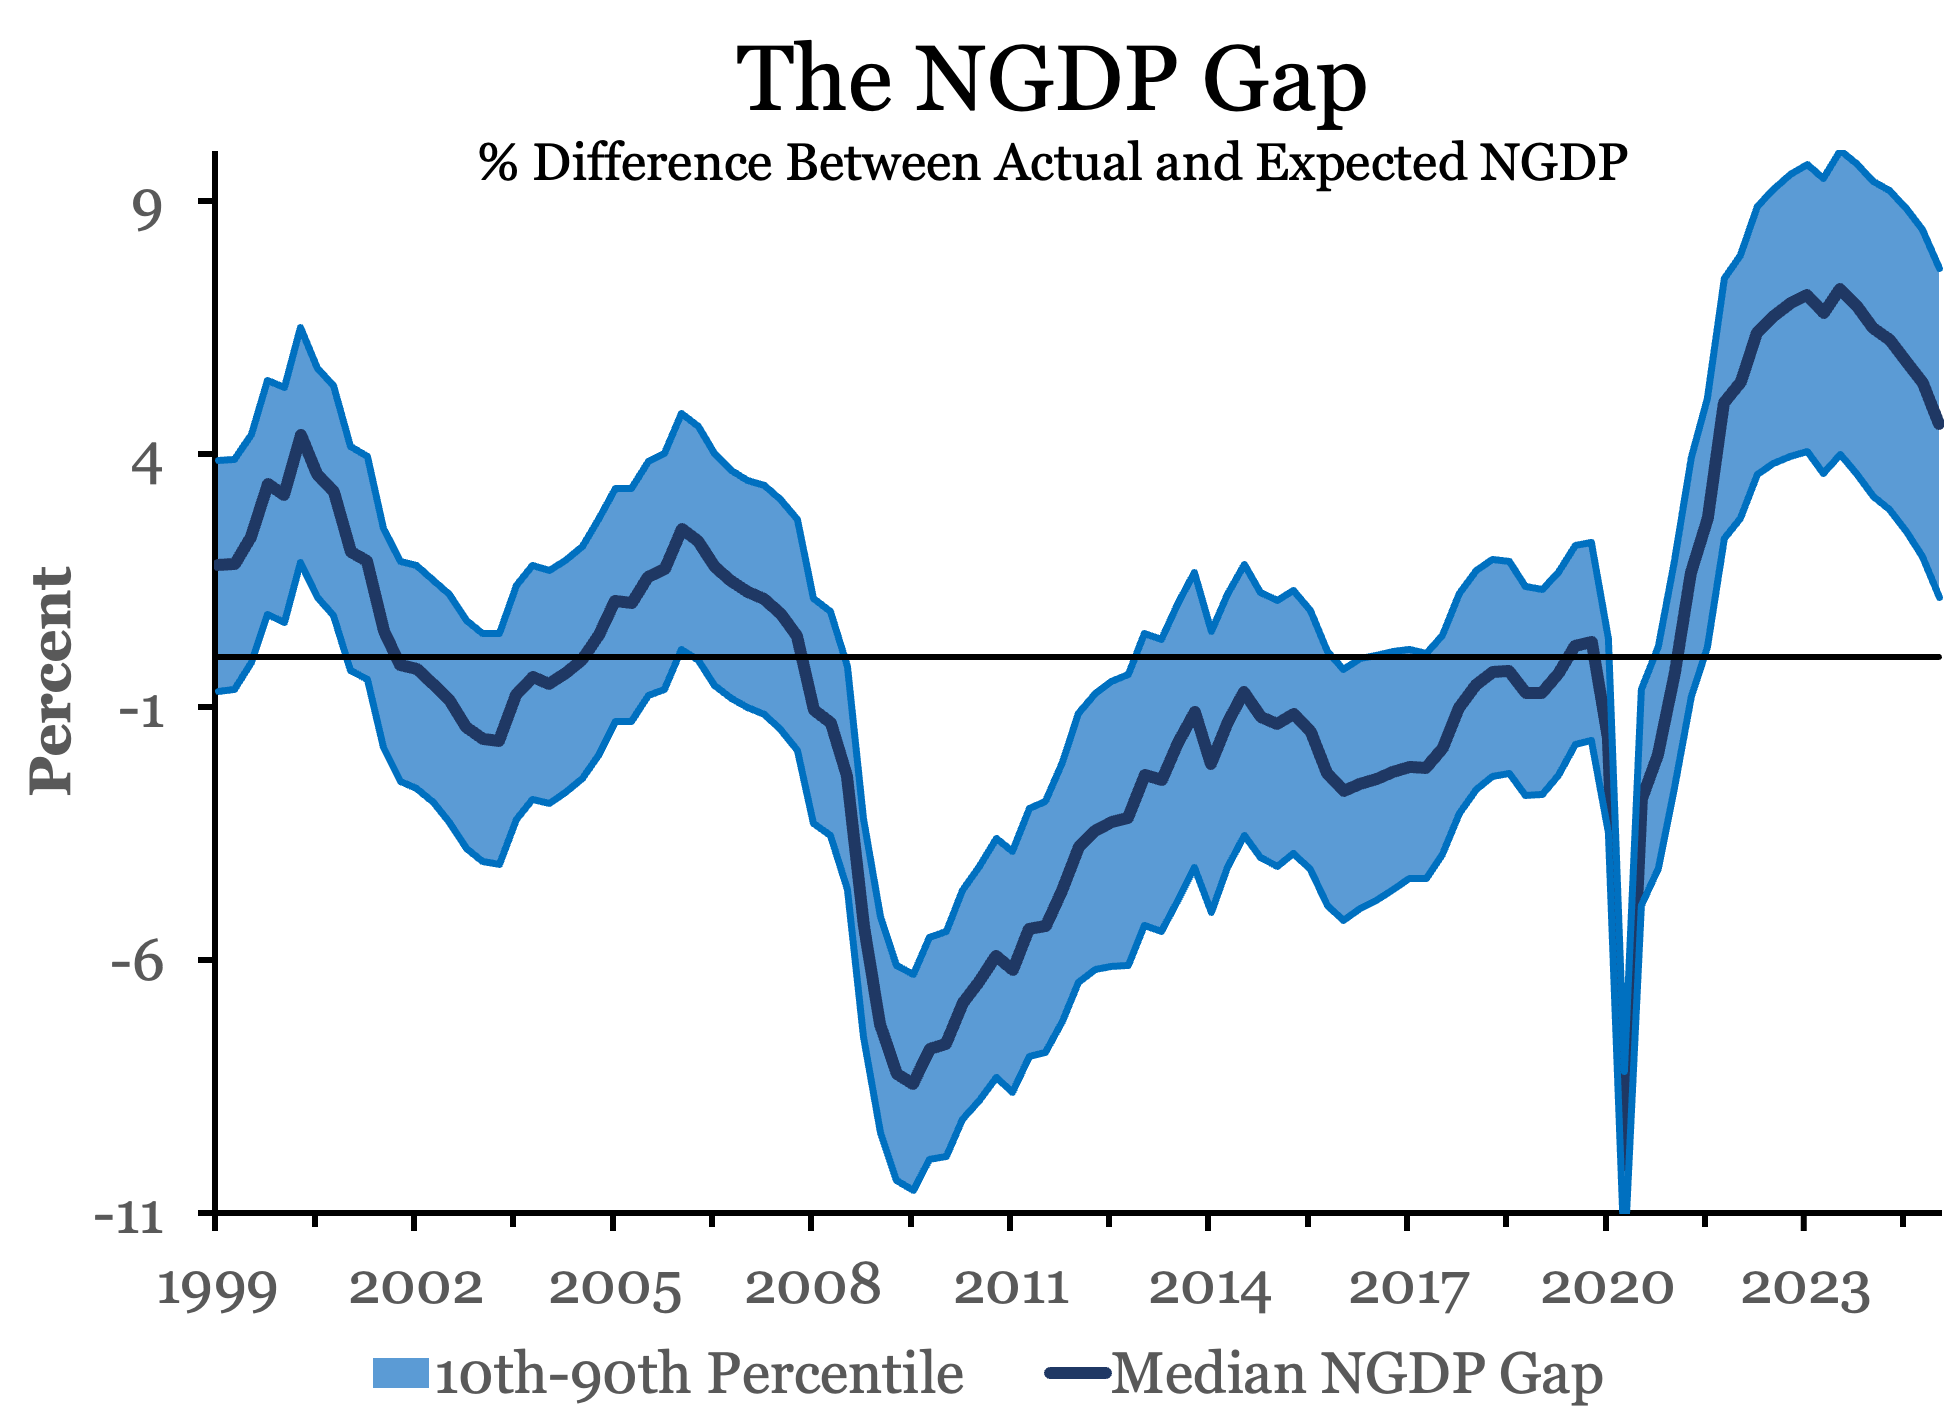
The NGDP Gap indicates that macroeconomic policy, which reflects both monetary policy and fiscal policy, has been in an expansionary state since late 2021 but is now slowly winding down. So what exactly does this tell us?
A Measure of Aggregate Demand Pressures
I first wrote about this measure in 2020. Treasury economists Andrew Martinez and Alex Schibuola expanded upon it 2021. Together, we further develop this idea in a forthcoming paper in the IJCB. In these papers, the name has evolved from a NGDP Gap to an “expectations gap,” but across all of them the key idea is that the measure is capturing excesses or shortfalls in aggregate demand pressures that drive the business cycle.
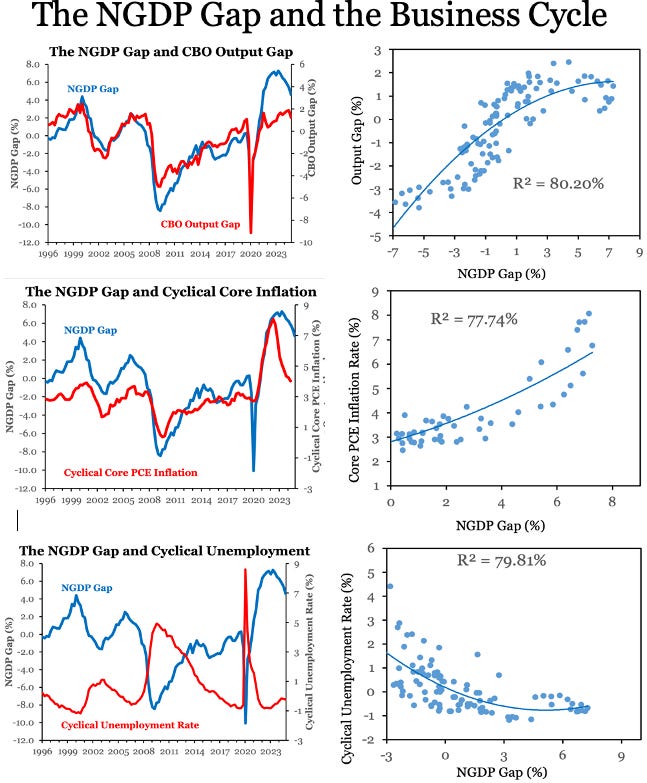
This understanding is illustrated in the figures below which plot the NGDP Gap against various measures of the business cycle: the output gap, cyclical core inflation, and cyclical unemployment. In each case, there is a strong relationship. This is interesting since the NGDP Gap is a simple measure based on forecasts, while these other measures are more complicated measures of cyclical activity.
Some may wonder why I use forecasts from the past 20 quarters for a given period. First, it is important to remember that in addition to the nominal spending forecasts made in the current period, there will be nominal spending forecasts made in subsequent periods that are for the same future date. Future periods, in other words, may have many different nominal spending forecasts applied to them, leading to potentially new and different economic decisions over time. Given this possibility, it makes sense to take an average of the different forecasts being applied to the same period. Second, I use 20 quarters since it empirically fits the data better than shorter forecast horizons as seen in the table below. Andrew Martinez and Alex Schibuola provide similar evidence for these longer forecast horizons too.

A Forward-Looking NGDP Gap
The baseline NGDP Gap measure reported at the Mercatus Center uses the publicly available Survey of Professional Forecasters (SPF) data. One can also use the Blue Chip Forecast (BCF) data, which also provides provides quarterly NGDP forecasts updated monthly. Both SPF and BCF create almost identical NGDP gap series, as seen below.
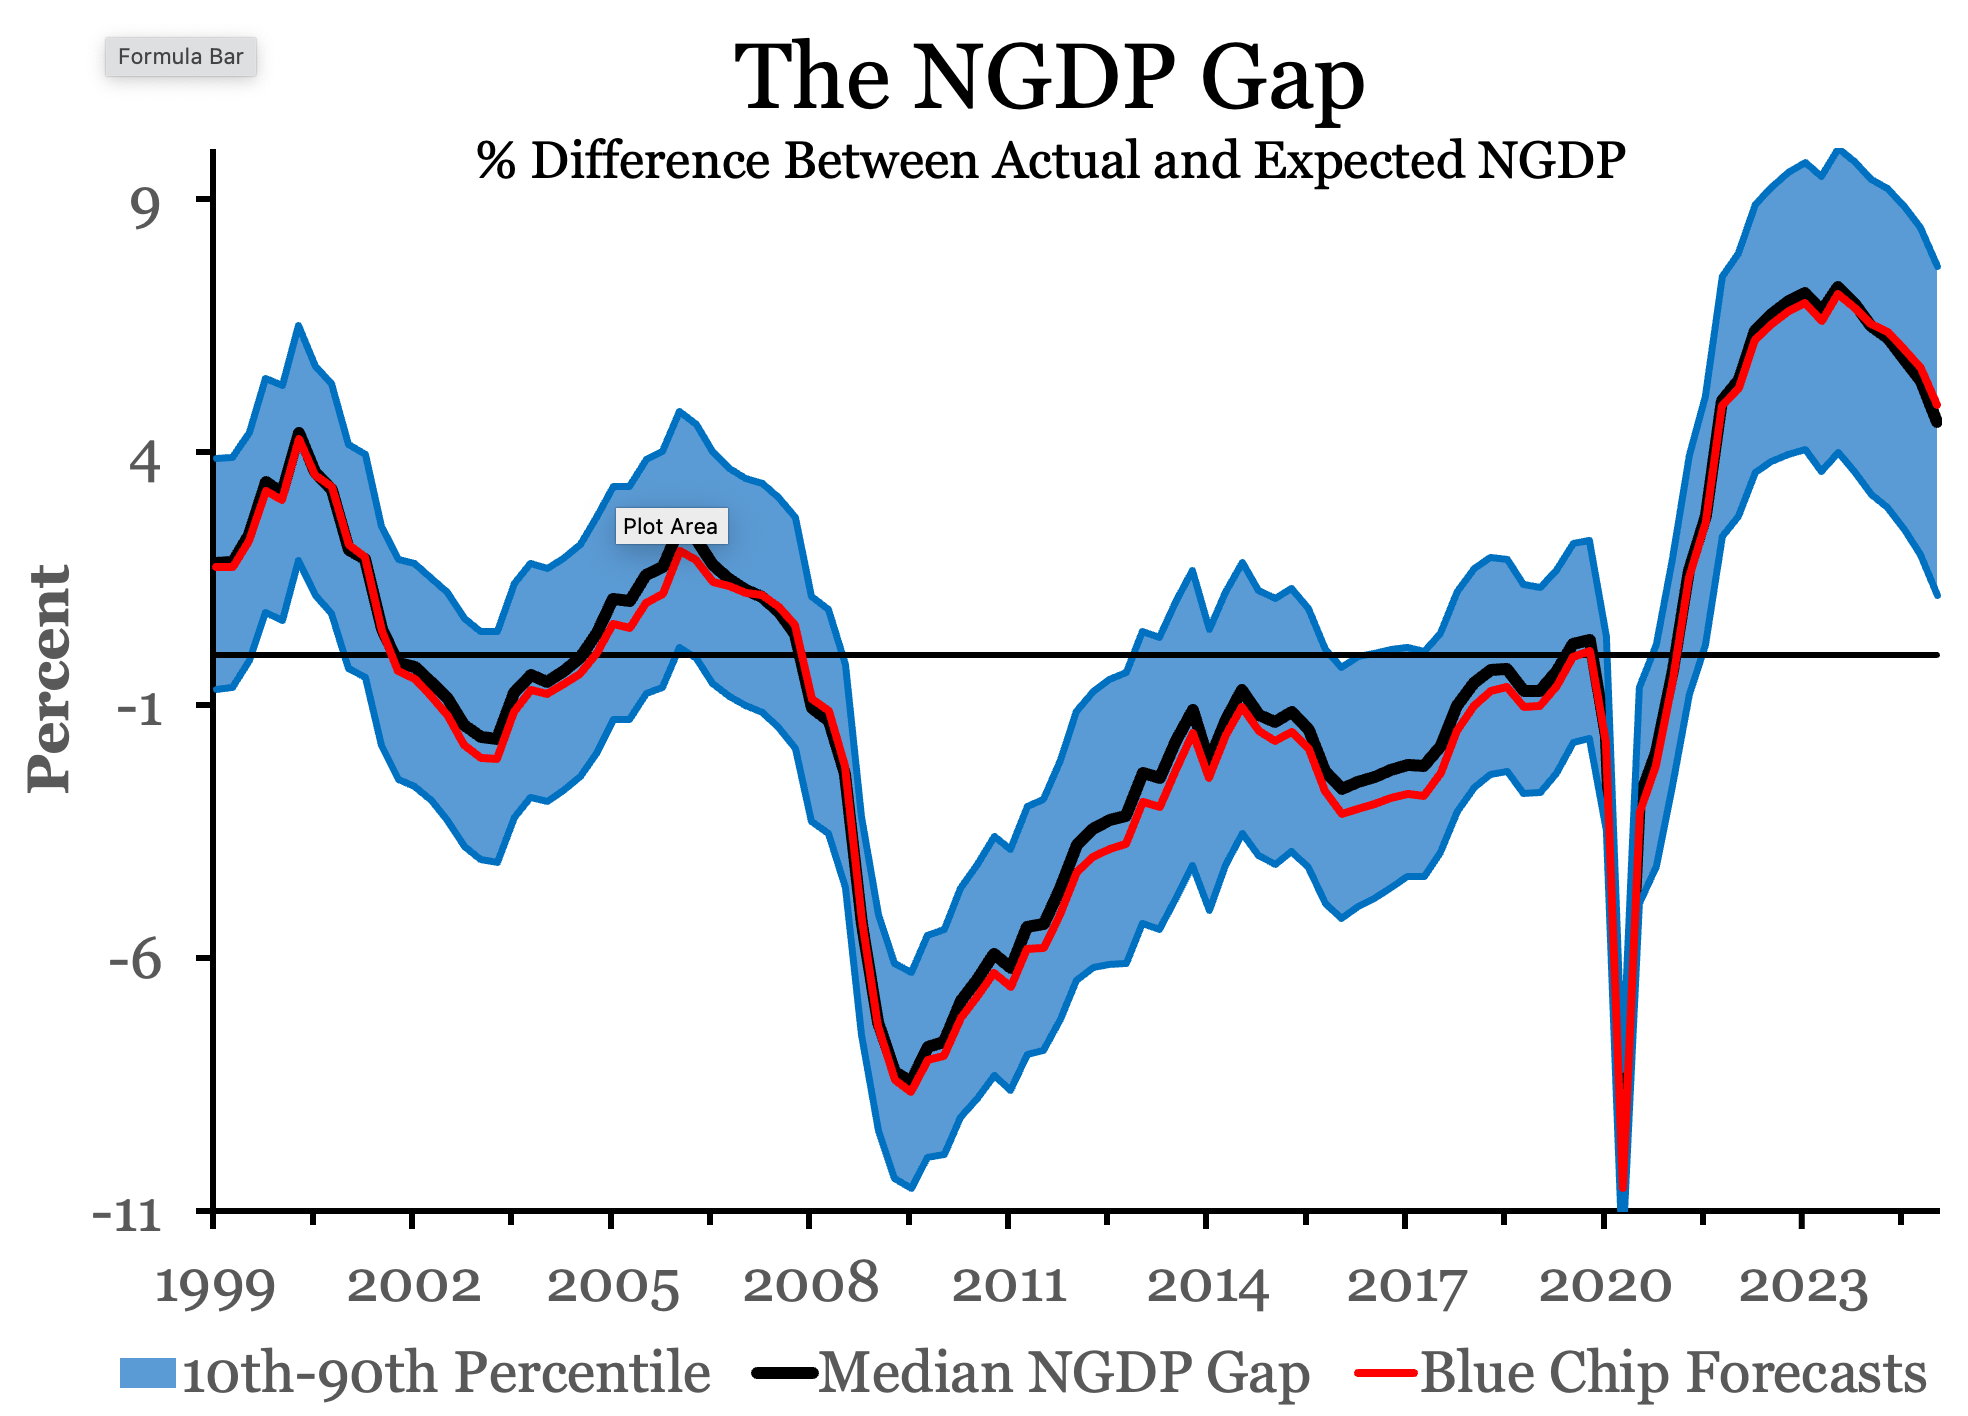
The BCF data, however, are useful for another reason — they allow for forward-looking NGDP Gap forecasts that can be updated monthly. Pat Horan and I outline how to construct them in this paper, but the key advantage to the BCF is that it allows one to make a monthly NGDP Gap forecast of future quarters.
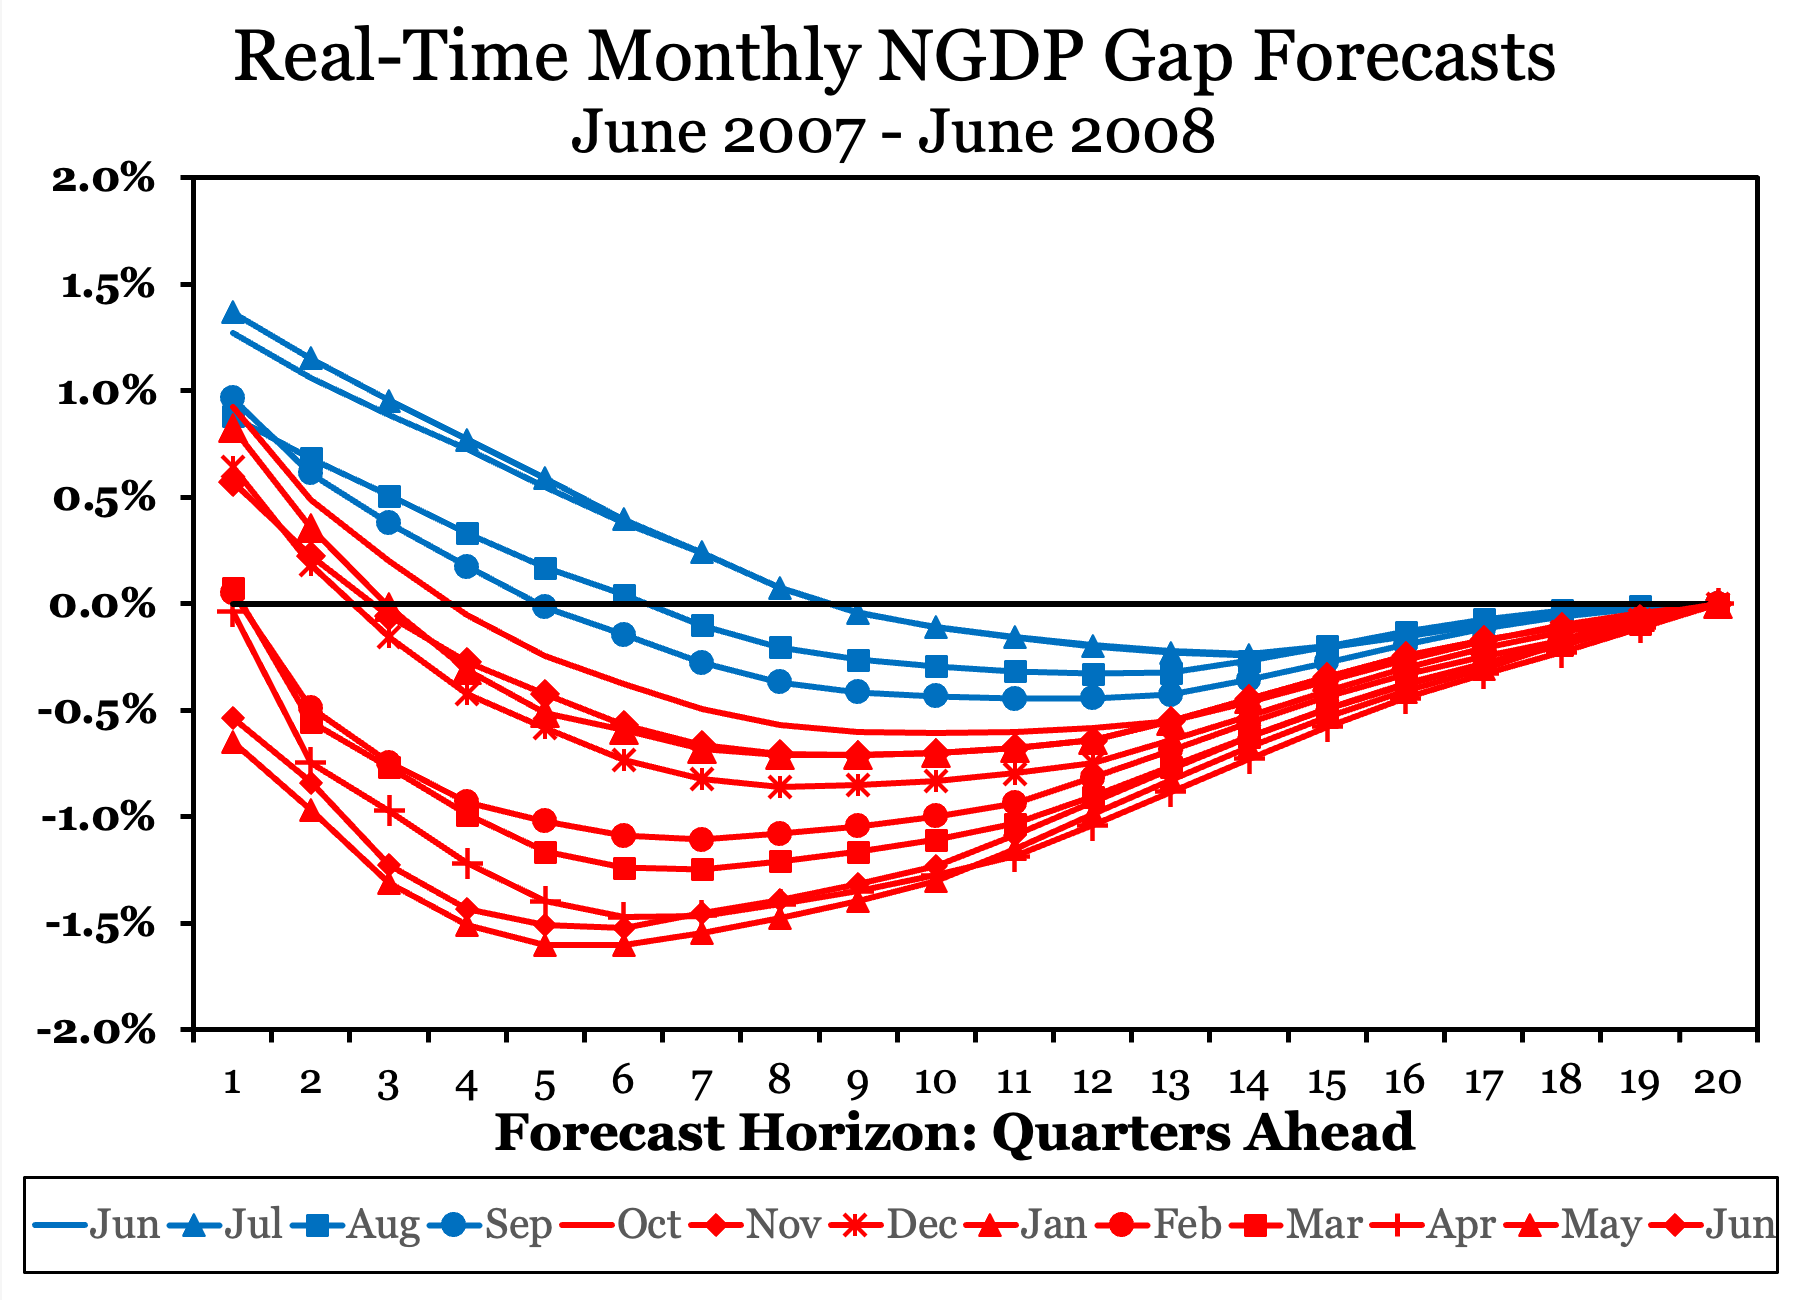
The figures below show real-time forward-looking NGDP Gap forecast for various months. These are, in other words, the monthly forecasts of future quarterly NGDP gaps that FOMC officials would have seen in real-time had they been looking at this series. The first figure shows forecasts were showing positive NGDP gaps through September 2007 that turned modestly negative six to eight quarters ahead (shown in blue). Starting in October 2007, however, the forecasted NGDP gaps show larger negative values as early as three quarters ahead. By March 2008, there was a clear shift to persistently negative NGDP gaps that were forecasted to grow over the next five to eight quarters. The forecasts in red for October 2007 and beyond would have warned FOMC members that a large aggregate demand shortfall was imminent.
The next figure shows the NGDP gap for 2021. It reveals that for the first four months the NGDP gap was forecasted to be negative and large, followed by a return to zero or slightly above it (shown in blue). Starting in May 2021, however, there was a pronounced shift to positive and sustained NGDP gaps (shown in red). The size of these gaps continued to grow each month, and by summer it became an unmistakable warning of an unfolding aggregate demand overshoot. If the FOMC had been paying close attention to these forecasts, it may have tightened monetary policy sooner and minimized the aggregate demand overshoot.

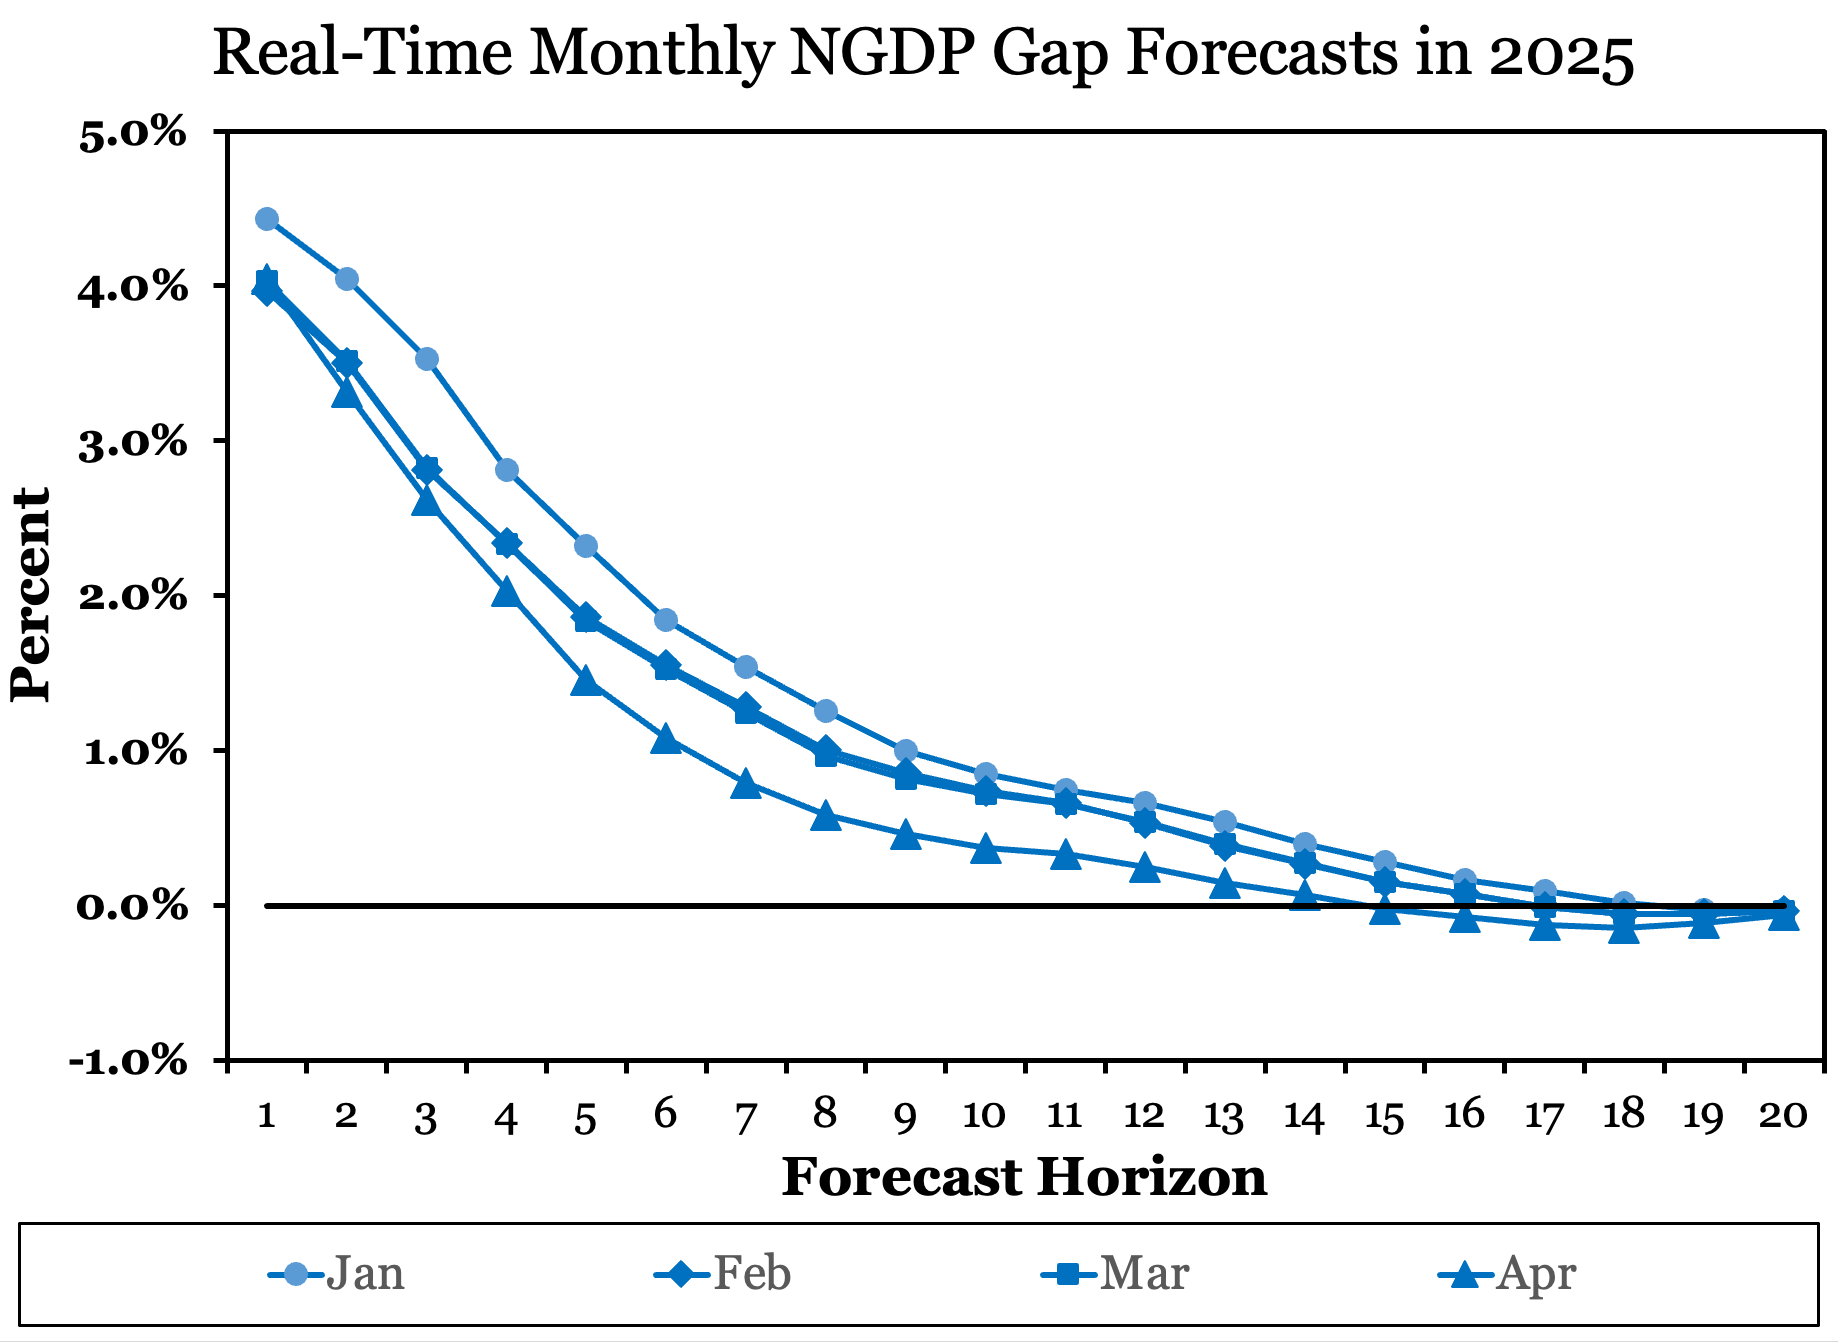
The next figure shows the NGDP Gap forecasts for the first four months in 2025. They look broadly stable and show the continued shrinking of the NGDP Gap to zero. April’s forecast shows some decline, but overall there is no forecasted collapse in aggregate demand. The April forecast was collected during the first week of April, so does not capture all the developments since then. It will be interesting to see what happens to this forecast over the next few months.
These NGDP gap forecasts provides a useful outlook for aggregate demand. They are easy to estimate using the forecast data, are available monthly, and provide a nice cross check to FOMC members in thinking through policy decisions.
Conclusion
In a world where nominal shocks can have real consequences, keeping track of total dollar spending relative to expectations is essential. The NGDP Gap provides a powerful and intuitive tool for monitoring the stance of macroeconomic policy and the pressures of aggregate demand. It complements more traditional business cycle indicators and offers a forward-looking lens that can help policymakers anticipate economic turning points.
As new data become available, I will continue to report quarterly on the NGDP Gap to provide regular updates on the state of the nominal economy. This ongoing check-in will help ensure that shifts in nominal demand are not overlooked, and that policy discussions remain anchored in a robust understanding of the dollar economy.
Great post! Looking forward to seeing further updates! Would be nice to have live charts with explanations similar to GDPNow, term premia, and r* landing pages on the ATL/NYC Fed websites.
Thank you for sharing these insights and your thoughts. Did you also look at forecast horizons beyond 20 quarters and if so, did it show a declining R squared or did it cap out at about 20 quarters?